A couple of days ago, NPR ran a piece on the recent growth in the U.S. of Active Clubs, “a strand of the white nationalist movement that emphasize[s] mixed martial arts training to ready their members for violence against their perceived enemies.”
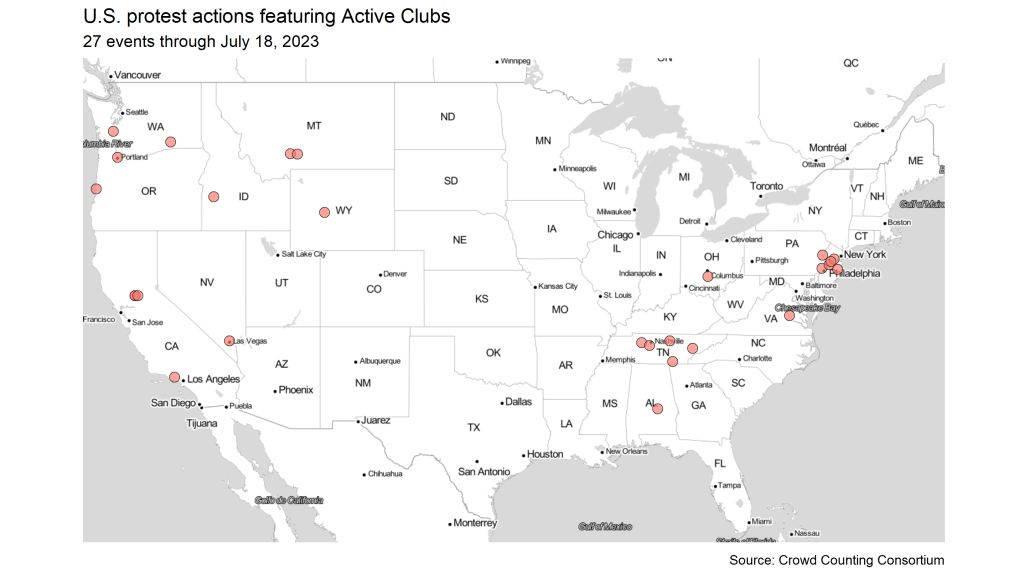
We can see this growth in Crowd Counting Consortium’s (CCC) data on U.S. protest activity. So far, CCC has logged 27 protest events in which at least one group with “Active Club” in the name has participated. As the map below shows, these events have spanned the country. We see clusters of events in the Pacific Northwest, California, Tennessee, and the Mid-Atlantic, but Active Clubs have also organized or participated in protests in Idaho, Montana, Wyoming, Nevada, Alabama, Ohio, and Virginia.
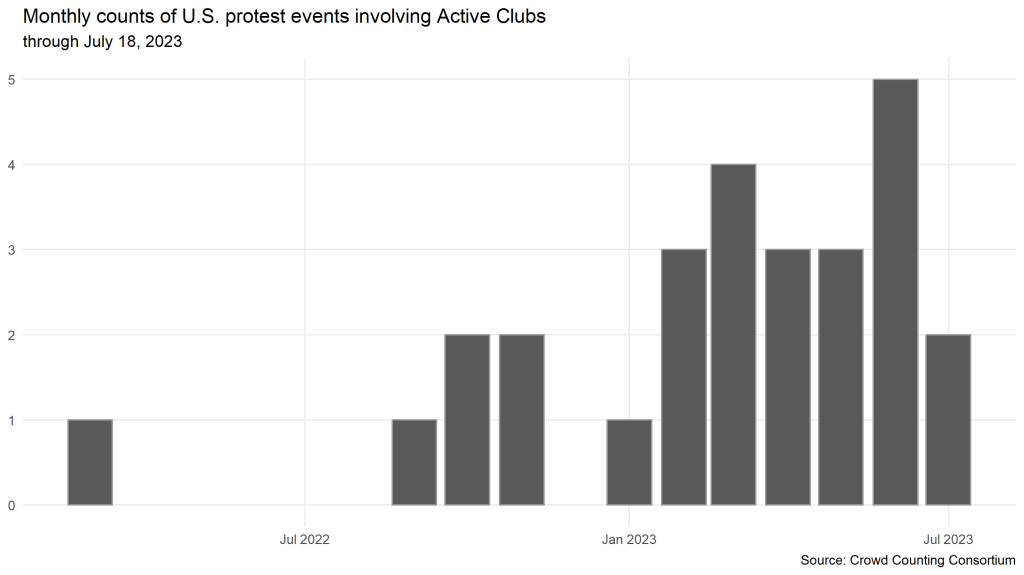
As NPR’s reporting indicates, groups operating under the Active Club brand are relatively new on the scene. Per the following chart, the first event in our data involving an Active Club came in March 2022, and 21 of the 27 Active Club events we’ve recorded so far occurred in 2023. The peak month for Active Club protest activity in our dataset is the most recent complete month, June 2023, and we’ve already logged two more Active Club–involved events in the first half of July.
Also consistent with the rapid-growth story, these 27 protest events have involved 13 different Active Clubs, and 10 of those 13 clubs made their first appearance in our dataset in 2023. Here’s a list of all the groups we’ve seen at protests so far, along with the dates and locations of their first appearances, the number of events at which we’ve seen them so far, and the names of other organizations that were present at any of the protests in which they’ve participated.
SoCal Active Club (March 12, 2022, in Thousand Oaks, CA; 1; White Lives Matter California, White Lives Matter Legion XIV)
Embrace Struggle Active Club (October 15, 2022, in Penn Valley, PA; 6; White Lives Matter Pennsylvania, White Lives Matter New Jersey, Garden State Nationalist Club, New Jersey European Heritage Association, National Socialist Youth Alliance, S14)
Tennessee Active Club (November 13, 2022 in Chattanooga, TN; 6; Tennessee Neighbors for Liberty, Patriot Front, League of the South, NSC-Dixie, White Lives Matter, Proud Boys, Protect the Children Now, Southern Sons Active Club, Alabama Active Club, White Lives Matter Alabama, Vinland Rebels, Heart of Dixie Active Club)
The Ohio Active Club (February 11, 2023, in Circleville, OH; 1; White Lives Matter Ohio, Patriot Front)
Evergreen Active Club (February 26, 2023, in Portland, OR; 6; Rose City Nationalists, Northwest Nationalist Network, Vinland Rebels, Proud Boys, White Lives Matter Montana, Big Sky Active Club, 14 Words)
Sons of Virginia Active Club (March 9, 2023, in Richmond, VA; 1)
NorCal Active Club (March 10, 2023, in Sacramento, CA; 3; Sacramento Proud Boys, White Lives Matter, Patriot Front)
Big Sky Active Club (May 20, 2023, in Bozeman and Livingston, MT; 4; White Lives Matter Montana, Evergreen Active Club, 14 Words, Northwest Nationalist Network, Vinland Rebels, Rose City Nationalists, Patriot Front, Wyoming Active Club)
Las Vegas Active Club (June 3, 2023, in Las Vegas, NV; 1; Clockwork Crew)
Wyoming Active Club (June 18, 2023, in Lander, WY; 1; Big Sky Active Club, Patriot Front)
Alabama Active Club (July 15, 2023, in Montgomery, AL; 1; Heart of Dixie Active Club, Southern Sons Active Club, Tennessee Active Club, White Lives Matter Alabama, Vinland Rebels)
Heart of Dixie Active Club (July 15, 2023, in Montgomery, AL; 1; Alabama Active Club, Southern Sons Active Club, Tennessee Active Club, White Lives Matter Alabama, Vinland Rebels)
Southern Sons Active Club (July 15, 2023, in Montgomery, AL; 1; Alabama Active Club, Heart of Dixie Active Club, Tennessee Active Club, White Lives Matter Alabama, Vinland Rebels)
We can also see in the CCC data how these groups, like many right-wing extremists of late, are explicitly linking homophobia and transphobia to their larger agendas — here, white supremacy or white nationalism. Of the 27 protest events we’ve logged so far that involved at least one Active Club, 16 (60%) included explicit anti-LGBTQ+ claims. That’s compared to five that included explicitly anti-semitic claims, two that specifically mentioned Rob Rundo, and one that featured a Confederate flag (unsurprisingly, the one in Alabama).
Finally, given the emphasis in the Active Club brand on training for violence, it’s worth noting that we’ve only seen a single counter-protester injured in a confrontation with Active Club members or their co-protesters at these 27 events. That casualty occurred in Bozeman, Montana, on May 20, 2023, when a participant in the Bozeman Pride Stroll who verbally confronted protesting Active Clubbers and other right-wingers got pepper sprayed in response.
As always, you can freely download the entire CCC dataset from the Nonviolent Action Lab‘s GitHub repository (here). For more information about what kinds of events those data do and don’t include and how we collect them, see our coding guidelines. For this analysis, I looked for the string “active club” (ignoring case) in the organizations field and selected for valence = 2 (right wing). If you’re an activist, journalist, or researcher who wants or needs some assistance in using the data, feel free to email me at julfelder@hks.harvard.edu.
After a year that saw historic levels of anti-LGBTQ+ protest activity, legislative action, and online jawboning, millions of people turned out in May and June 2023 for hundreds of LGBTQ+ pride celebrations across all 50 U.S. states and the District of Columbia.
Specifically, Crowd Counting Consortium (CCC) has logged more than 470 LGBTQ+ pride marches, rallies, festivals, parades, and even bike rides since the start of May 2023 through the first weekend of July, and we continue to add others as our research process uncovers them. So far, we only have estimates of crowd sizes for 158 of those events, or about one-third of them. Across just those 158 events, though, we tallied nearly 5.9 million participants, give or take a million and a half. Seven of the 10 largest pride events in the U.S. this year fell on the last weekend in June, the traditional peak of pride season, and they spanned the entire country: from New York City on the East Coast to Seattle and San Francisco out west, and from Houston and St. Petersburg down south all the way up to Chicago via Denver, Columbus, and St. Louis.*
Across those more than 470 events, we only saw reports of counter-protests at 67 of them, or about 14 percent. We expect that some additional fraction also involved counter-protests that weren’t reported by our sources, but the fact that they weren’t reported implies that those actions were probably small or otherwise not particularly noteworthy.
Of the 67 pride celebrations where counter-protests were reported by our sources, 19 of those counters, or about 28 percent, involved white supremacists and other far-right groups. Of those 19, only four involved Proud Boys, the group that had reportedly threatened on social media to turn Pride Month into Proud Month. Five of the 67 counters involved Patriot Front; another five involved various chapters of White Lives Matter; and five more involved one or more Active Clubs. While these types of groups continue to protest outside drag shows and Drag Story Hours at historic rates, they did not make much of a splash at pride events in 2023.
A smattering of those 67 events saw counter-protests by more than one right-wing extremist group. Consistent with the larger theme of this post, though, the most violent clash we saw around all those several hundred pride events in the past 10 weeks was actually a brawl between two groups of far-right counter-protesters — the Proud Boys and the Rose City Nationalists — that happened blocks away from the targeted pride event in Oregon City, Oregon, on Saturday, June 24.
Meanwhile, we only saw reports of injured participants at two pride events in the past 10 weeks. The first occurred in Bozeman, Montana, on May 20, when a pride celebrant who engaged with a group of white-supremacist counter-protesters outside a Drag Story Hour at a local bookstore got pepper-sprayed and struck. The other occurred in Hot Springs, Arkansas, in early June, when a sign-holding counter-protester responded to parade-goers who approached and verbally confronted him by punching one of them in the face (and then getting arrested).
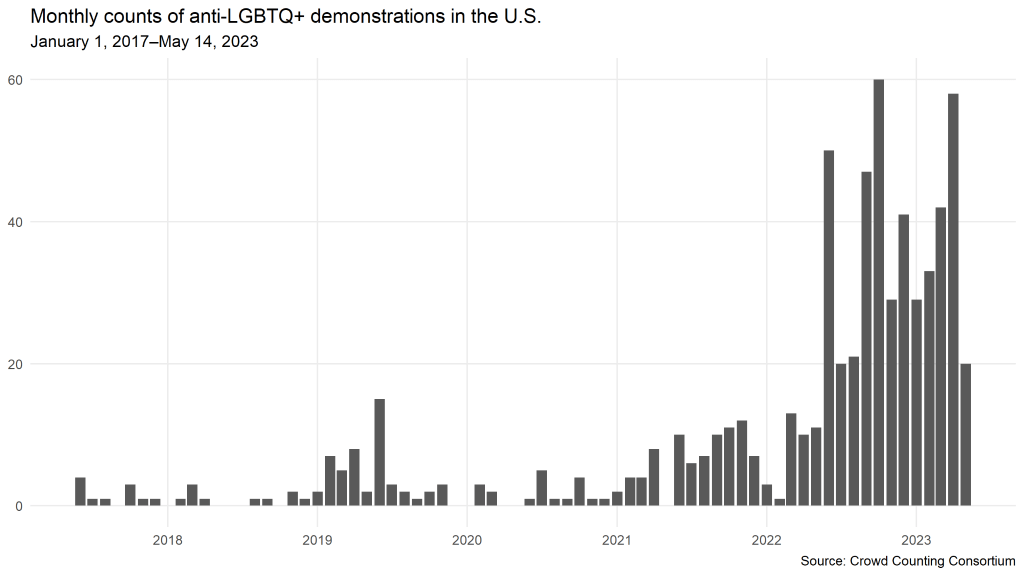
Over the past couple of years, a lot of folks — myself included — have focused on telling the story about how the right has ramped up its attacks on LGBTQ+ peoples’ equality and visibility, and how this sustained campaign is harming and even killing people. In a few posts on this blog, I’ve posted versions of the chart below, which shows how anti-LGBTQ+ protest activity has surged since mid-2022, and how that surge still shows no signs of abating. In fact, we can see from this updated version of the chart that anti-LGBTQ+ protest activity leapt to new heights during Pride Month, with more than 150 events in June 2023 alone. We also know that the hostile political climate led to the cancellation or relocation of some pride events or elements of them, and many others invested significant time and money in added security measures.
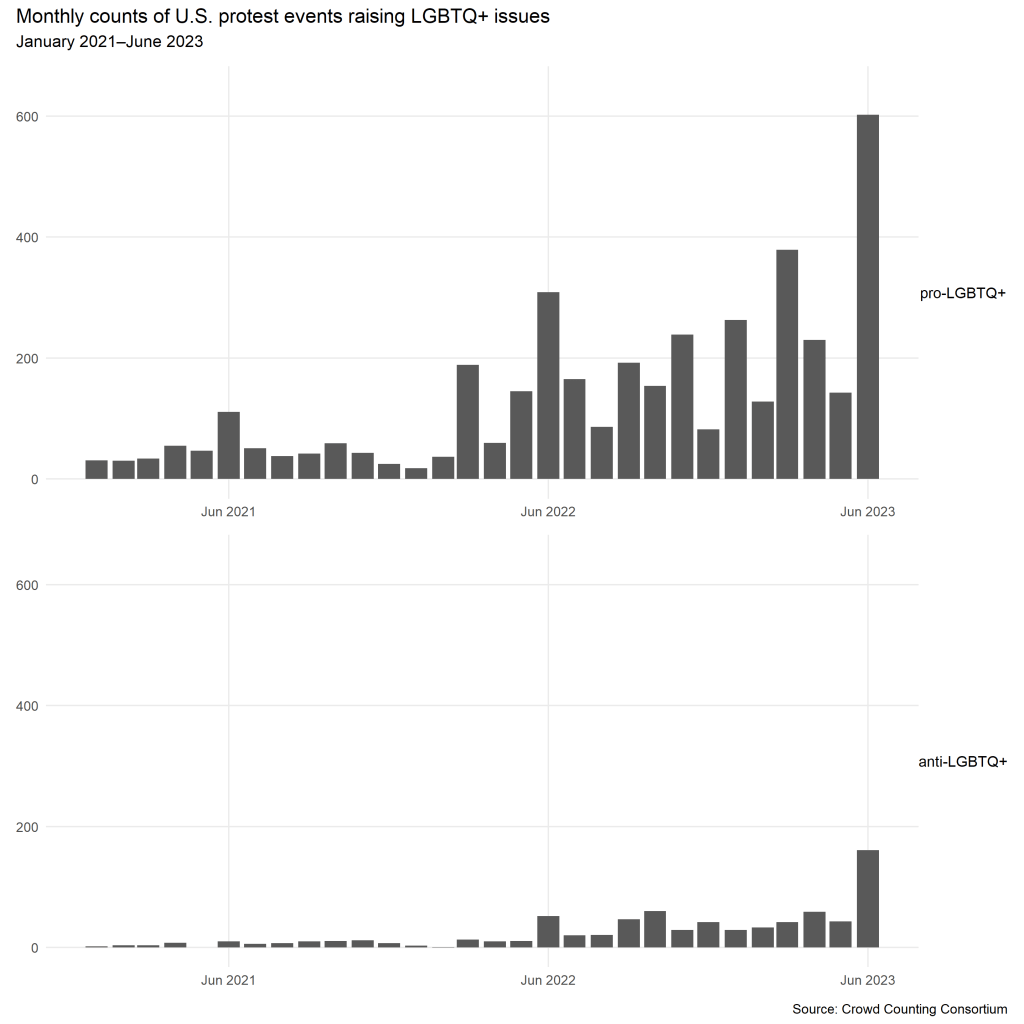
The threat summarized in that chart is urgent and dire, and while it’s vital that we keep sounding that alarm as long as the threat persists, it’s also important that we show how resilient and joyful queer people and their allies continue to be in the face of that incessant firehose of hostility and hate. So, here’s that same chart juxtaposed with one showing pro-LGBTQ+ protests, demonstrations, rallies, and the like over the same period. The monthly counts for LGBTQ+ rights and equality and liberation consistently dwarf the anti-LGBTQ+ ones, and as the latter have surged, so have the former.
Finally, it’s also notable that, despite — or maybe because of? — the ongoing national wave of right-wing attacks on the queer community, the scope of American LGBTQ+ pride celebrations continues to expand. Of those more than 470 pride events we saw in the past 10 weeks, at least 22 were the first edition of what are meant to be annual events in their towns, and the reported crowd sizes at those first-ever events averaged in the several hundreds.
* CCC only tracks events that are free and open to the public and not solely organized by a local government or government agency. So, these tallies exclude festivals and shows that required paid tickets to enter, as well as flag-raising ceremonies, festivals, and parades exclusively organized by local or county governments. This post was originally published on July 3, 2023. This version was published on July 6, 2023, using updated CCC data that included more events.
On Saturday, May 20, 2023, more than 1,000 tenants, union members, community organizers, and politicians gathered at Cadman Plaza in the rain and then marched across the Brooklyn Bridge to call for lower rents in New York City and the passage of state legislation to protect tenants from eviction without good cause.
The scale and tenor of this weekend’s march reflects a broader trend in U.S. protest activity in recent years. Since early 2020, the U.S. has seen a surge in protests related to housing, Crowd Counting Consortium (CCC) data show, as rising rents, a shrinking supply of lower-cost housing, pandemic-specific stresses, and stagnant wages have driven housing insecurity to fresh extremes.
The figure below charts the dramatic increase in housing-related protests over the past few years. From January 2017 until early 2020, CCC logged an average of 11 housing-related protests nationwide each month. Since June 2020, we’ve recorded an average of 87 of these events per month. In the first four months of 2023, that average has jumped to nearly 146, and we have already logged 114 of these events in the first three weeks of May.*
This wave of protests has coincided with an affordable-housing crisis that pairs high and still-rising costs with a shrinking supply of low-rent units. In a March 2023 blog post, the Joint Center for Housing Studies at Harvard University reported that “the number of cost-burdened renters who pay more than 30 percent of their incomes on rent hit a 20-year high of 21.6 million households in 2021,” including a record 11.6 million households devoting more than half of their incomes for housing. Meanwhile, on the supply side, “The number of units with contract rents under $600 in real terms dropped by nearly 1.2 million from 2019–2021, marking one of the largest two-year declines of the last 15 years.”
Those market trends are reflected in the demands organizers and participants have made at the protest events CCC has recorded. Early in the pandemic, we saw a spate of actions focused on the need for protections for renters whose incomes had abruptly shrunk or stopped altogether during COVID lockdowns. As the pandemic dragged on, we saw a new flurry of protests against the end of temporary eviction protections and supplemental income measures adopted by policymakers at various levels in response to those initial pressures. In recent months, rising rents have become a focal point, sparking chants like “La renta sube, sube! El pueblo sufre, sufre!” (“The rent goes up! The people suffer!), “Rent rollback!”, and, simply, “The rent is too damn high!”
The current wave of mobilization against housing insecurity also extends to areas we don’t typically think of as focal points for housing activism — including college campuses. In recent months, we’ve seen protests at schools such as Cal Poly Humboldt, UMass Amherst, and University of Rochester by undergraduate students concerned about the scarcity or poor condition of on-campus housing and the rising cost of off-campus rents. Over the past two years, we’ve also seen rallying and striking graduate students and other campus workers at schools like Cal State Long Beach and across the UC system specifically call out exorbitant housing costs as one reason they urgently need higher pay.
The ongoing housing crisis has also spurred other forms of collective action, such as rent strikes. While CCC does not track rent strikes, we have seen rallies associated with them over the past few years in cities from Oakland to DC.
Finally, all of this is happening at the same time that the number of unhoused people in the U.S. is growing; some cities and counties are adopting policies that effectively criminalize homelessness; and more unhoused people are being murdered. In the CCC data, activism on these themes runs the gamut from vigils held nationwide each winter solstice in remembrance of people who died while experiencing homelessness to extended protest encampments like Sacramento’s Camp Resolution and this year’s Stop Hunting Us action in Ashland, Oregon. In New York City just a few weeks ago, the killing on a subway train of Jordan Neely, a young and unhoused Black man, sparked a continuingseries of protests that have decried intertwined problems of poverty, racism, and the dehumanization and vilification of people experiencing homelessness. None of those problems is expected to abate any time soon.
* NOTE: Some of the increase in monthly counts of housing-related protests since 2020 is due to concurrent expansions of CCC’s collection procedures, but those changes in the research process probably only explain a fraction of the growth. Since the start of 2021, the average monthly event count in the entire CCC data set has roughly doubled, from about 1,460 to 2,750, while the average monthly count of housing-related protests in the data set has more than quadrupled.
In late 2022, I guessed that the surge in anti-LGBTQ+ right-wing protests we saw in the summer and fall of last year would ebb after the elections. Over the past few years, right-wing protests have tended to cycle through focal issues every few months, and I figured that 2022’s flurry of actions targeting the queer community was, for the most part, an instrument funders and organizers were using to try to mobilize voters for the midterms.
I was wrong. As the chart below shows, right-wing activists have maintained the unusually high pace of anti-LGBTQ+ protest activity through the winter and spring of 2023. Since June 2022, CCC has recorded an average of 39 anti-LGBTQ+ protests nationwide each month, compared with just three per month from January 2017 through May 2022. In the first four full months of 2023, we’ve logged an average of nearly 41 anti-LGBTQ+ protests each month, up slightly from the pace set in the latter half of last year.
Notably, this issue also continues to absorb a heightened share of the right’s attention. Since the start of 2022, more than 6 percent of all right-wing protests recorded by CCC nationwide have involved anti-LGBTQ+ claims. That might not sound like a lot, but the share from 2017 until 2022 was just 1.6 percent. In other words, over the past year and a half, right-wing protests have been almost four times as likely to include anti-LGBTQ+ claims as they were in the preceding five years.
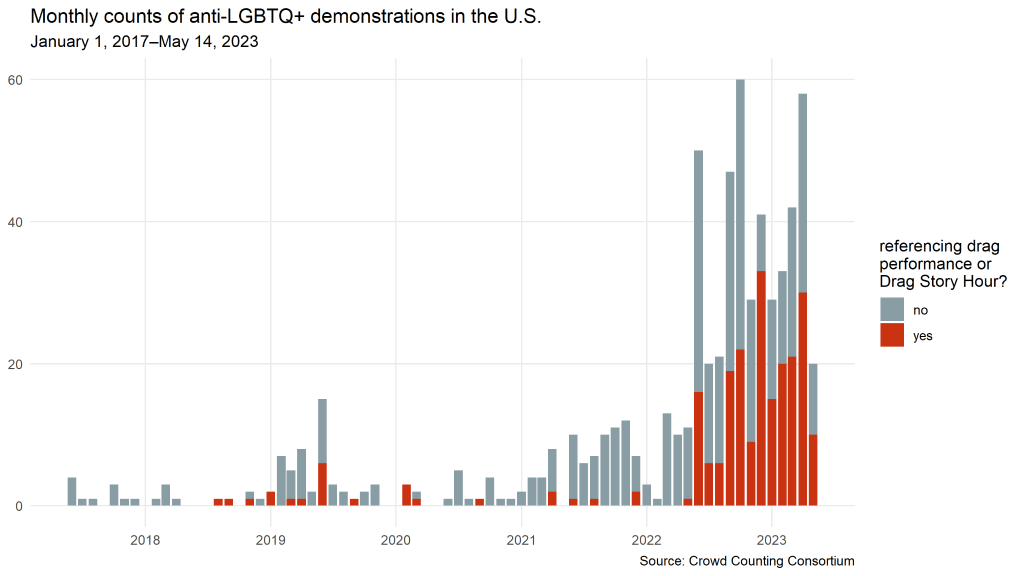
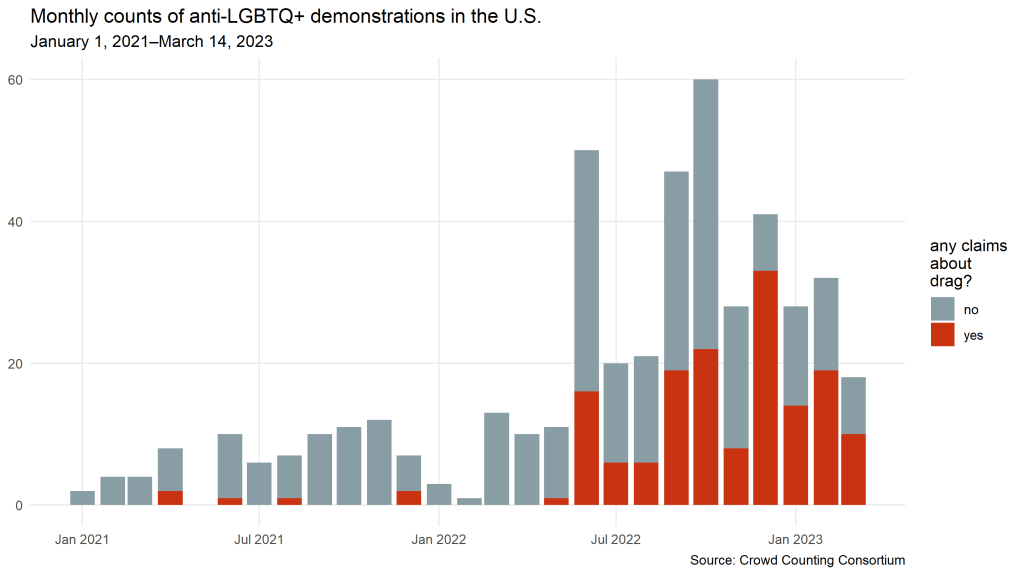
As the following chart shows, drag performances and drag culture have been a particular focal point for anti-LGBTQ+ protesters in recent months. Since June 2022, 46 percent of anti-LGBTQ+ protests have referenced drag, compared with just 12 percent from 2017 through May 2022. Roughly half of that 46 percent, or about 22 percent of these hundreds of anti-LGBTQ+ events overall, have specifically targeted Drag Story Hour readings for children.
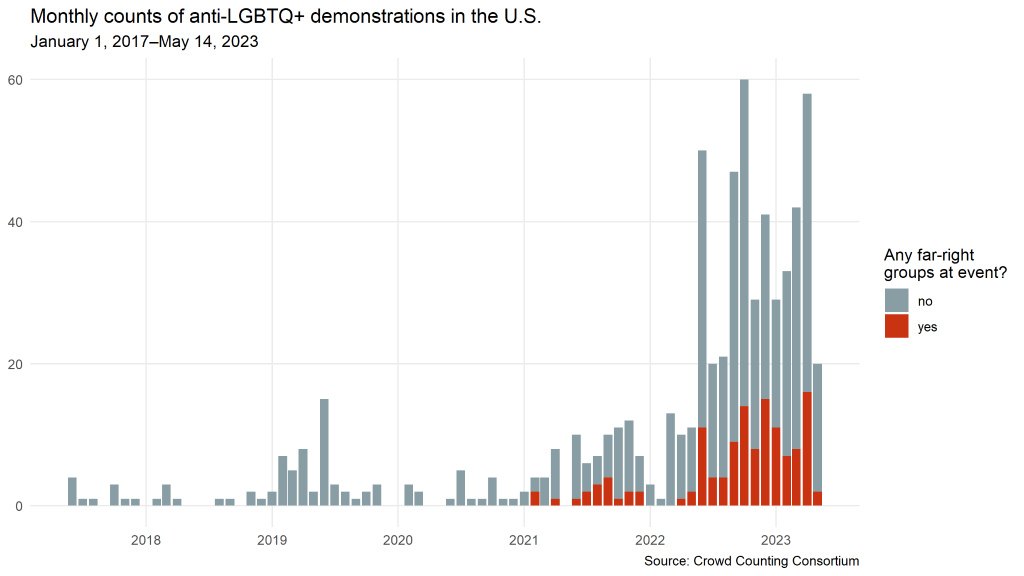
Also notable — and evident in the chart below — is the increased presence of Proud Boys and other far-right groups at these events. For purposes of this chart, I looked for any of the following in the fields in the CCC data where we capture information about organizations that participated: Proud Boys, Patriot Front, White Lives Matter, National Socialist Club (including but not limited to NSC-131), Goyim Defense League, any Active Clubs, and the National Justice Party. Since June 2022, we’ve seen members of one or more of these extremist groups at roughly 24 percent of all anti-LGBTQ+ protests nationwide. For the Proud Boys specifically, the figure is about 19 percent.
Far-right groups have been active on this issue, in part, because their ideologies typically feature patriarchy and homophobia, but also because these events are useful public-relations opportunities. Once an issue like anti-LGBTQ+ activism captures the news media’s interest, fringe organizations often glom onto events involving that issue as a way to get themselves and their ideas in front of more cameras and readers. This visibility helps normalize their presence and ideas and serves as a valuable recruiting tool. The whole thing can become a bit of a vicious cycle, as extremist groups increasingly show up to try to grab the mic and the spotlight, and reporters show up because the presence of extremist groups — and possible confrontations with antifascist counter-protesters — often makes for eyeball-grabbing and click-generating content.
So, measured by event counts, the pace of right-wing anti-LGBTQ+ activism clearly hasn’t slowed in 2023. Measured by crowd size, however, the wave does show some signs of slowing. From June through December 2022, the average size of the crowd at the anti-LGBTQ+ events for which we had information about that feature was 164 people. So far in 2023, it’s been just 67 people.
What’s more, these actions are not going unchallenged. Since June 2022, nearly 43 percent of the anti-LGBTQ+ protests logged by CCC that were not themselves counters to things like pride parades or rallies over legislation have been met with direct counter-protests. That’s compared to just 5 percent of right-wing protests during the same period that did not include anti-LGBTQ+ claims. Just as the queer community and antifascists and other allies have mobilized to fight the torrent of anti-LGBTQ+ bills passing through state houses in the past few legislative cycles, they have also regularly turned up to confront this bigotry in the streets.
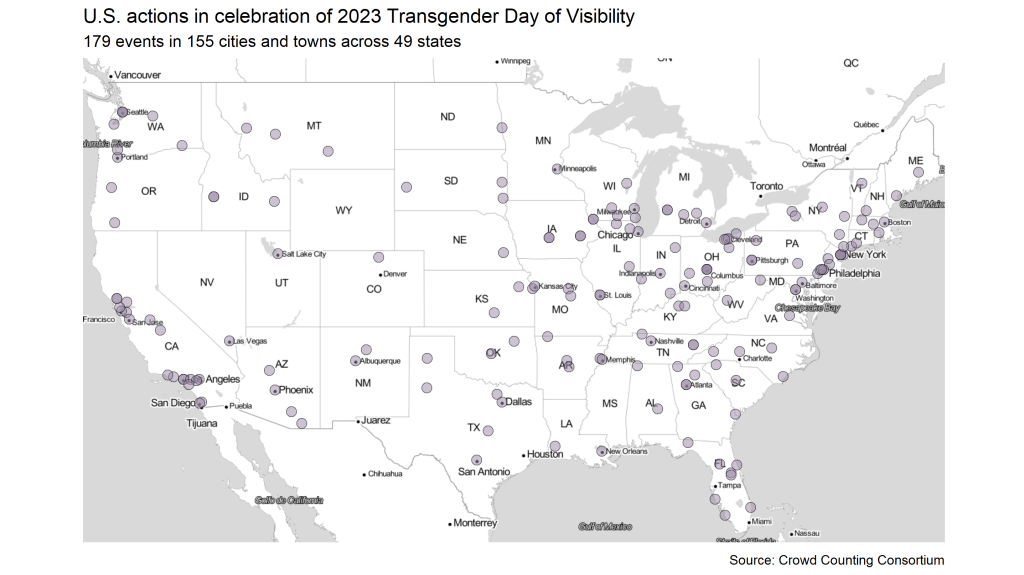
Each year since 2009, people around the world have gathered on March 31 (or close to it) to mark International Transgender Day of Visibility (TDOV). In 2023, the U.S. saw nearly 180 TDOV events in 155 different cities and towns across 49 states, according to data collected so far by Crowd Counting Consortium (CCC). That’s up from just 15 events in 2022 and almost certainly the largest and broadest celebration of TDOV in history.
As of this writing on April 2, 2023, we only have information on crowd sizes for 45 of those 179 events. From just those 45, however, we estimate a total crowd size of nearly 8,500, give or take several hundred. The median crowd size for those 45 events was about 100, and several cities — including New York, Philadelphia, San Francisco, and Washington, DC — saw crowds that reportedly approached or exceeded 1,000.
TDOV ballooned in the U.S. in 2023 because of the torrent of anti-trans bills surging through state legislatures this year, and the wave of public harassment and terrorism that has accompanied it. In direct response to those trends, Queer Youth Assemble (QYA) — a youth-led organization formed in 2021 in response to rising anti-LGBTQ+ sentiment and legislative action — put out a call for coordinated national marches and rallies on TDOV with a focus on queer and trans youth autonomy. Nearly 140 of the events CCC has recorded so for TDOV 2023, or about three-quarters of them, were either organized by, or in associaion with, QYA and its list of demands.
Not all of this year’s actions were affiliated with QYA’s call, however. In New York City, for example, Black Trans Femmes in the Arts (BTFA) hosted several celebratory perfomances across multiple boroughs. In Upper Darby, Pennsylvania, UDTJ hosted a flag-raising ceremony for TDOV at the Township Building, as they have done in years past. And in Eugene, Oregon, antifascists organized a vigil and rally under the title Trans Day of Vengeance — the same title used by another group of organizers in the DC metro area who chose to cancel their April 1 event after it became the target of a right-wing media blast that led to a torrent of violent threats.
This year’s historic mobilization for TDOV is part of a broader and still-swelling wave of activism for LGBTQIA+ rights in response to the salvos of reactionary state legislation and right-wing protest and terrorism mentioned above. As noted in a previous blog post and updated in the chart below, this wave really picked up steam in early 2022 after the passage of Florida’s so-called Don’t Say Gay law, but it has kept rolling across the ensuing months. The broad turnout for this year’s TDOV helped produce the highest monthly count of pro-LGBTQ+ actions ever recorded by CCC, which has been tracking U.S. protest activity since January 2017.
In addition to tracking information about things like an event’s date and location and crowd size, CCC tries provide a more complete and nuanced picture of what each event was “about” by recording verbatim claims from participants’ signs and banners and chants as seen in photos or video or reported by journalists in their write-ups. By far the most common claim at the 2023 events from which we’ve seen participant claims so far was “Trans rights are human rights” (26 events), followed closely by “Protect trans kids” (13) and “Protect trans youth” (11), then “Trans lives matter” (5), “Black trans lives matter” (5), “Protect trans lives” (5), “Respect existence or expect resistance” (4), and “Trans liberation now” (3). In total, we have recorded more than 320 unique claims from these events so far, and we expect that count to grow as we see new articles, videos, or social media posts about this year’s actions. Some of my personal favorites from the long tail of claims we’ve seen once or twice so far include “The trans agenda is an average life expectancy”, “Fuck your gender roles”, “Girls will be boys”, “Keep your bills and bans off queer trans bodies”, “More glitter less bitter”, “No more dead trans women”, “Our joy is radical”, “The future is fluid”, “This body is my creation”, and “Stop trans genocide”.
Flags often serve as an important vehicle for political symbolism and expression at protest events, so we record information about those, too. Unsurprisingly, the Trans Pride flag was by far the most common one at this year’s TDOV actions, seen at 38 events so far, followed by the Progress Pride flag (27), Rainbow Pride flag (16), and Nonbinary Pride flag (12). We’ve also recorded one or a few instances of the Bisexual Pride flag (4), Pansexual Pride flag (4), Asexual Pride flag (2), Lesbian Pride flag (2), Straight Ally flag (2), Aromantic Pride flag (1), Genderqueer Pride flag (1), and Intersex Pride flag (1). A few events also saw participants waving American flags, alone or, in one instance, blended with the Rainbow Pride flag. And, finally, we saw one instance each of a blended Rainbow Pride/Gadsden flag, the national flag of Cuba, and a Trans Pride flag with a picture of an alligator above the slogan “Fuck around and find out.” (We use the University of Northern Colorado Gender and Sexuality Resource Center’s guide to pride flags for this task.)
For the past three legislative cycles, state lawmakers have tabled record numbers of bills that harmfully target LGBTQ+ people or seek to enforce chauvinistic ideas about sexuality and gender norms. Crowd Counting Consortium (CCC) data show how that torrent of legislative hate and harm has helped to spur a counter-mobilization that includes — but isn’t limited to — a substantial and ongoing wave of protests and other demonstrations against those bills.
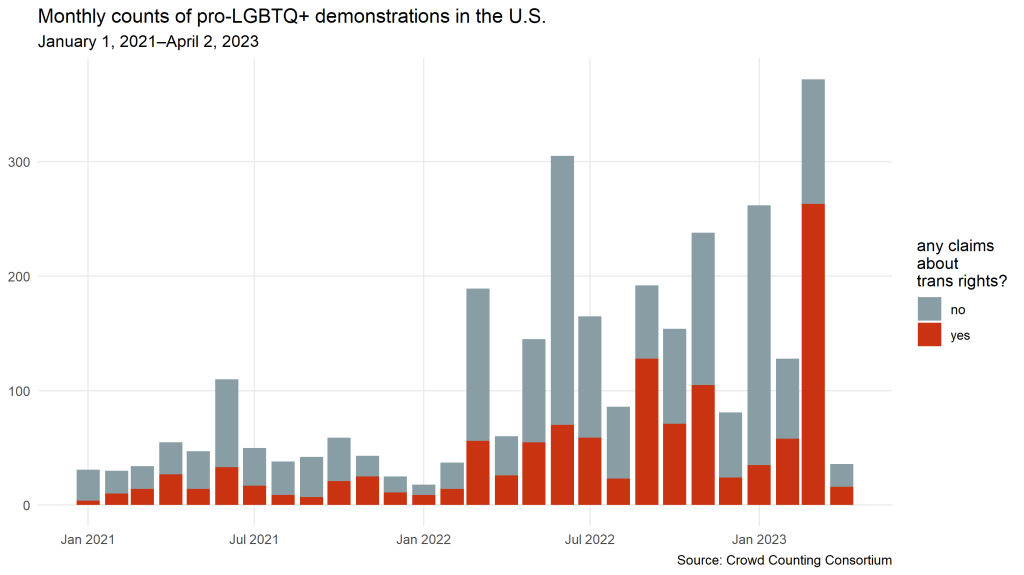
The column chart below shows monthly counts of pro-LGBTQ+ demonstrations in the U.S. from January 1, 2021, through March 14, 2023. In the columns, the red parts indicate what share of each month’s events included any demands or claims by participants about legislation.
As the chart shows, pro-LGBTQ+ demonstrations surged in March 2022, when students across Florida staged scores of walkouts in response to the passage of that state’s so-called Don’t Say Gay bill, which sharply limits classroom instruction on sexual orientation and gender identity. The rate of pro-LGBTQ+ demonstrations nationwide has remained high ever since, however, averaging more than 160 per month over the following year. In just the first two weeks of March 2023 — a busy month in many state legislative calendars — CCC has already logged more than 100 pro-LGBTQ+ demonstrations, and more than half of them have explicitly referenced state legislation.
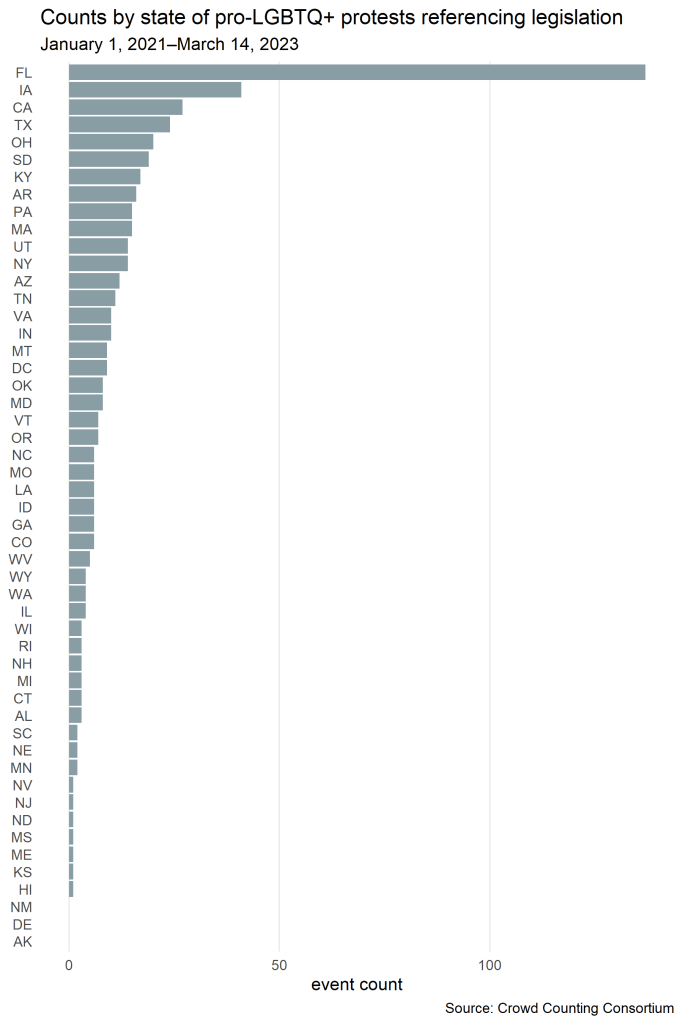
Notably, a sizeable share of these demonstrations are occurring in states that don’t typically factor in national conversations about the LGBTQ+ community or left-wing activism, because that’s where many of these bills are advancing or even passing into law. The chart below shows counts of pro-LGBTQ+ demonstrations referencing legislation (the red parts of the columns in the previous chart) by state over that same period. Florida — the third-largest state by population and, according to Governor DeSantis, “where woke goes to die” — leads by far with nearly 150 events, and first– and second-largest states California and Texas also rank in the top five. More telling, though, is the appearance near the top of that list of much smaller “red” states like Iowa, South Dakota, Kentucky, Arkansas, Utah, Montana, and Oklahoma, to name a few.
Iowa’s extraordinary position as second on that list is due in no small part to a coordinated set of student walkouts on Wednesday, March 1, 2023, that was led by Iowa WTF and the Iowa Queer Student Alliance and drew more than 1,000 students from at least 27 schools across 21 cities and towns, according to CCC data. This fight has continued to draw large crowds in opposition there, with an estimated 2,000 people gathering on the steps of the capitol in Des Moines for the Rally to Resist on Sunday, March 5, and hundreds turning out in both Davenport and Cedar Rapids this past Saturday, March 11.
These unusually large event counts and crowd sizes in smaller, more conservative states demonstrate how local LGBTQ+ organizations and communities and their allies are mobilizing and fighting back against this unprecedented wave of legislative threats to their rights, dignity, health, and even survival.
Importantly, malicious legislation is not the only threat driving this uprising. As we’ve discussed on this blog before, over the past year, the queer community has also faced a historic wave of anti-LGBTQ+ activism in the streets, with a peculiar and apparently intensifying fixation on Drag Story Hour events and other drag performances.
As shown in the chart below, this wave of reactionary protests surged around Pride Month in 2022 and again in the fall. Although it peaked in October in the run-up to Election Day, it has persisted through the winter — typically a seasonal downtime for all forms of protest — and into 2023. As we discussed in our overview of right-wing protest in 2022, while the crowds at these protests sometimes include groups engaged in quiet prayer and other less threatening activities, they have also drawn a smorgasbord of violent and openly fascist actors who look to terrorize performers and attendees, bully community-defense organizations, and draw media attention that can help them normalize their extremism and recruit new members.
Neither those threats nor the mobilization against them show any sign of abating soon, and calls from organizers lead us to expect scores if not hundreds more demonstrations in defense of the LGBTQ+ community nationwide over the next few weeks.
On Friday, March 17, organizers in several cities, including Boston, Chicago, Denver, Madison, and Spokane, are coordinating rallies against anti-trans legislation and hate on what they’re calling Trans Day of Resistance.
March 31 is International Transgender Day of Visibility. In addition to regular celebrations of that day across the country, a student-led group in Florida, Project Caerus, has called for school walkouts to protest anti-LGBTQ+ laws and rhetoric in their state.
That same day, Queer Youth Assemble — which organized a wave of student walkouts spanning more than a dozen states in March 2022 — has called for demonstrations in all 50 state capitals and Washington, DC, as part of what they’re calling the March for Queer & Trans Youth Autonomy.
On March 31 and April 1, Trans Radical Activist Network is teaming with Our Rights DC to lead a weekend of marches and protests under the title Trans Day of Vengeance with “stop trans genocide” as its slogan.
We’ll be tracking those (and thousands of other) events as they are announced and occur in our monthly Google Sheets, which are publicly visible, and in the compiled and augmented version of our full dataset on our GitHub repository. If you’re an activist, journalist, or researcher interested in using the data or statistics or visualizations derived from them, please drop me a line at julfelder@hks.harvard.edu. All of this data is freely available to the public without registration, but I’m happy to provide guidance or advice on how to use it as needed.
“Police kill so many people that each death drowns out the last.”
Olayemi Olurin tweeted that sentence this morning, and the violence she describes echoes through Crowd Counting Consortium’s data on protest activity across the United States. We record new protests, vigils, demonstrations, marches, banner drops, and direct actions in response to police brutality every day. The names and locations change, but the flow is relentless.
The chart below shows daily counts of protest events against police brutality, loosely construed, from the start of 2021 to the end of January 2023. There are notable surges, including a large one in spring 2021 around the first anniversary of the murder of George Floyd, and then a smaller but still significant one in recent weeks after the killing of Manuel “Tortuguita” Teran in Atlanta’s Weelaunee Forest on January 18 and the January 27 release of video showing the fatal beating of Tyre Nichols in Memphis.
What may be most noticeable in that chart, though, is the near-constancy. In several places—McCarren Park in Brooklyn, New York; outside the Sherman Oaks Galleria in L.A.; in front of city hall in Rockford, Illinois; and on the square in downtown Wooster, Ohio—daily actions that began in the summer of 2020 continue more than two and half years later. In dozens of other towns from Maine to Georgia to Oregon, Black Lives Matter–themed vigils and demonstrations recur weekly or monthly. Meanwhile, when bursts of activity in response to a police killing or death in custody die down in one town, there are always loved ones and activists busy organizing new protests or vigils somewhere else.
The map below shows that neither fatal encounters with police nor protests against them are regionally specific. While police killings—as documented by the remarkable Mapping Police Violence project—and protests against them occur more often in major urban areas on the coasts and in the upper Midwest, we also see many of both scattered across sparsely populated parts of the Midwest and Great Plains and desert Southwest. No part of the country escapes this perpetual crisis.
The red dots on that map, and the green bars in the chart preceding it, represent nearly 9,000 protest actions against police brutality across more than 800 different cities and towns, just since the start of 2021. Those nearly 9,000 events mention more than 500 different names.
On the evening of January 24, I drove to DC’s Meridian Hill/Malcolm X Park for a vigil honoring Tortuguita. Police sat in numerous cars on at least two sides of the rectangular park, and a handful of officers stood in the grass 40 or 50 yards away. By my count, more than 150 people came out in the cold to light candles, write postcards to activists jailed in Atlanta, contribute their art to a banner, and, in some memorable cases, take to the mic to verbalize their rage and grief.
Just a few days later, many of the same people were back out in response to the video showing police officers fatally beating Tyre Nichols. Per DCist:
In Franklin Park, activists with the local abolitionist group Harriet’s Wildest Dreams held space for about 50 community members ahead of the release of video footage showing the officers’ fatal beating of Nichols, a father of a four-year-old. Later in the evening, a small group gathered in Lafayette Square, growing to about 50 demonstrators by 8 p.m. chanting “no justice, no peace.”
Both events dwindled within a few hours, amid a mood of exhaustion among longtime organizers. Several told DCist/WAMU that they would not march through the streets for a lengthy protest – exhausted by decades of police violence and killing of their community members. Instead, they said they are resting and saving their energy to support the community’s needs.
“Black people die every fucking day at the hands of the police,” Mikki Charles, an organizer with Harriet’s Wildest Dreams, told the crowd at Franklin Square. “The list is endless. And I’m tired of coming out here and listing every single name that’s been killed.”
The Crowd Counting Consortium recorded more than 13,400 left-wing protests, counter-protests, rallies, demonstrations, and direct actions in more than 2,000 different U.S. cities and towns in 2022, where “left-wing” includes everything from Democratic partisan rallies to demonstrations by communist, anti-fascist, or anarchist groups. This post summarizes a number of patterns and trends we observed in those events.
In 2022, the U.S. saw several waves of protests and rallies for reproductive rights against a backdrop of persistent activism against structural racism and police violence. Environmental concerns, LGBTQ+ rights, and gun reform also featured significantly in left-wing protest activity over the course of a year that brought worsening news about the climate crisis, a surge in anti-queer activism and terrorism from the right, and nearly 650 new mass shootings. The incidence of arrests, protester injuries, and property damage at left-wing protests all declined further from their 2020 peaks, while the count of armed left-wing protests increased slightly.
CCC makes and freely shares the data on which this analysis is based in hopes of supporting scholarship, journalism, and activism on these issues. For details on definitions and methods underlying these data, please see our coding guidelines. To access the data and documentation, please visit our GitHub repository. If you are a scholar, researcher, journalist, or activist who is interested in working with the data set and have questions about how to use it, please contact Jay Ulfelder at julfelder@hks.harvard.edu.
Counts
In 2022, CCC logged more than 13,400 left-wing protests across more than 2,000 different U.S. cities and towns. That’s a 7-percent increase over the roughly 12,500 left-wing protests we recorded across 1,878 cities and towns in 2021, and—consistent with long-standing patterns—more than twice the count of right-wing protests we saw in 2021 (about 5,700; for a discussion of trends in those, see this blogged report.)
We were able to find information on crowd sizes for about 39 percent of the left-wing events we recorded in 2022, up from 34 percent in 2021. At the roughly 5,200 events for which we had information about crowd size, we saw approximately 2.6 million participants, give or take a million. The mean crowd size at events with information on it was just under 500, while the median was 50, both up from 121 and 40, respectively, in 2021. New York City’s annual Pride March was by far the largest of those events, with “thousands” or “millions” of participants and observers, depending on which source you consult. (Since its inception in 2017, CCC has consistently regarded LGBTQ+ pride festivals and parades as inherently political and included them in its collection process, a status implicitly reaffirmed by the recent surge in right-wing mobilization against them.)
Arrests occurred at 170 left-wing events in 2022 (1.3 percent), down significantly from 284 in 2021 (2.3 percent) and far below the more than 1,000 events (5.6 percent) with arrests in 2020.
Protesters damaged property at 86 left-wing events in 2022 (0.6 percent), down from 105 (0.8 percent) in 2021 and 550 (2.9 percent) in 2020. Damage in 2022 ranged from graffiti and broken windows to arson.
Participants were reportedly injured at 45 left-wing events in 2022 (0.3 percent), down from 66 (0.5 percent) in 2021 and 379 (2.0 percent) in 2020.
Three participants died at left-wing events in 2022.
On February 19, a right-wing counter-protester shot and killed 60-year-old June Knightly as she was helping escort a march for justice for Amir Locke in Portland, Oregon.
On June 19, a teenager attending a Juneteenth celebration in Washington, DC, was shot and killed in an attack that was not related to the event’s politics.
Participants evidently carried firearms at 46 of the left-wing events (3.3 percent) we recorded in 2022, up a handful from 42 (3.3 percent) in 2021. (We only began consistently tracking this information for all events we log in 2021, so we can’t provide comparable statistics for 2020.)
Themes
The bar chart below shows counts of protest events in 2022 at which participants’ demands were linked to the several dozen issues we routinely track with tags based on protester claims. Individual events can and often do raise any number of issues, so the sum of the counts shown in the chart is much larger than the annual count of events reported above.
Racism and policing have been two of the most common themes in left-wing protest activity since 2020, and that pattern persisted in 2022. Some of these protests occurred in response to new cases of police killing Black people, including (but not limited to) Amir Locke, James Williams, Jayland Walker, Patrick Lyoya, and Donnell Rochester. Hundreds of others were gatherings that recurred monthly, weekly, or evendaily to keep boosting the Black Lives Matter movement’s calls for racial justice and police reform or abolition.
While racism remained the single most commonly raised issue in 2022, reproductive rights nearly displaced it, and leapfrogged over policing, due to several waves of action in response to the Supreme Court’s reversal of Roe v. Wade. As shown in the chart below, protests related to abortion rights spiked four different times in 2022:
In early May, right after Politico reported on the leaked draft ruling in the Dobbs case;
In early October, when Women’s March led the Women’s Wave of rallies connecting the defense of women’s and reproductive rights to voting for pro-choice candidates in the upcoming midterm elections.
For the period from the May 2 leak until Election Day on November 8, CCC recorded nearly 4,000 protests calling for abortion access across more than 1,200 U.S. cities and towns. By comparison, the George Floyd uprising of 2020—possibly the largest protest wave in U.S. history—involved nearly 9,700 protests across more than 3,050 cities and towns during the 10 weeks from late May until the end of July.
The judiciary and women’s rights rounded out the top five themes in 2022 because of their linkage to abortion access and reproductive rights.
The environment was the next-most common theme in left-leaning protests last year. The two busiest days on this topic in 2022 were March 25, when Greta Thunberg’s Fridays for Future called another global climate strike, and Earth Day, April 22. In some ways, though, the puzzle of left-wing activism of 2022 was that there weren’t even more environment-themed actions, given the increasingly evident urgency of the climate crisis. Even the busier of those two days last year, the March climate strike, barely saw more than 100 events across the U.S., far fewer than the hundreds associated with the Global Climate Strike of September 2019, and a September 2022 global strike called by Fridays for Future produced only about 30 actions in the U.S., according to our data.
LGBTQ+ rights also ranked among the top 10 issues raised at left-wing protests last year. In addition to new and longstanding annual pride parades and festivals, communities also mobilized in 2022 to push back against a wave of state legislative actions and right-wing protests and violence targeting the queer community.
Guns rounded out the top 10 issues raised by left-wing protesters in 2022. Led by March for Our Lives and Everytown for Gun Safety, crowds mobilized nationwide in the wake of mass shootings at a supermarket in Buffalo, New York, and an elementary school in Uvalde, Texas, to call for federal and state legislation tightening access to firearms. The attack on Club Q in Colorado Springs in November and the 10-year anniversary of the mass shooting at Sandy Hook Elementary also spurred waves of activism around gun violence. Education also landed in the top 10 themes for 2022 because of the references to school safety at protests following the Uvalde mass shooting and in the many Sandy Hook remembrance vigils.
Rhetoric
This past spring, CCC began using the ‘claims’ field in our data set to capture verbatim as many non-duplicate slogans and chants we see in photos and video and from, and prose about, each event as we can, along with coders’ summaries of protesters’ aims. The result is a rapidly growing corpus of protest rhetoric that helps us describe what protests were about in participants’ own words.
The centrality of abortion rights and Black Lives Matter activism to left-wing mobilization in 2022 is plain to see in a chart of the 20 phrases we saw or heard most often from protesters over the past year. A full 17 of the 20 phrases—including nine of the top 10—relate to reproductive rights or women’s rights. The phrase “Black Lives Matter” ranked fourth, and the “no justice no peace” refrain often heard at protests against racism and police violence cracked the top 20 as well. The only other theme with a phrase in the top 20 was gun reform, as “protect kids not guns” landed in the middle of the chart between “never again” (often seen on homemade posters at protests for abortion rights alongside an image of a wire hanger) and “keep your laws off my body”.
A word cloud of more than 6,800 distinct terms from all those verbatim phrases tells a similar story. More interesting here is the color and variety of the language used, especially across those thousands of protests for abortion rights. Lots of references to bodies and body parts (uterus, vagina, ovaries, cervix, pussy, womb), religion (church, rosaries, theocracy, Jesus), specific Supreme Court justices (especially Alito, Barrett, Thomas, Kavanaugh, and Roberts), a few Spanish words (aborto, libre), and—especially in the wave of events immediately following the June 24 SCOTUS ruling—a fair amount of cursewords (fuck, fucketh).
Armed Community Defense Groups
One notable trend evident in our data from 2022 was the growth in activity by armed leftist and anarchist groups, including but not limited to John Brown Gun Clubs (JBGCs) and chapters of the Socialist Rifle Association (SRA). We saw JBGCs at 29 protest or counter-protest events in 2022, up from 7 in 2021 and 5 in 2020; and we saw SRA chapters at 7 events in 2022, up from 2 in 2021 and none in 2020. Of the 29 events at which we saw JBGCs in 2022, 19 related to LGBTQ+ rights, and 11 were counter-protests. Notably, we also saw 14 different named JBGCs at those 29 events in 2022, up from three in 2021 (Puget Sound, Elm Fork, and Connecticut) and one in 2020 (Puget Sound).
Mainstream media coverage often lumps these groups together with right-wing militias an casts them as part of broader and problematic escalation of political violence, but that view obscures some crucial differences. Most importantly, these leftist groups construe themselves as agents of community defense rather than self-appointed enforcers of a particular political or legal order. They are, in the words of one prominent JBGC, “intolerant of injustice,” and they aim to help protect targeted groups against violent expressions of it. Rather than deputizing themselves as proactive peacemakers, as various right-wing militias did in the summer of 2020, these organizations generally only come when invited and included in security planning, and they typically adopt a protective posture rather than a confrontational one.
That’s not to say there are no parallels. Similar to many right-wing militias, even when operating under a common label, these community defense groups generally lack central governance. As a member of one JBGC put it, John Brown Gun Club is a decentralized brand rather than a formal organization or hierarchical network. Also like some right-wing militias, these groups routinely engage in a variety of other activities consistent with their missions, including firearm practice, first-aid training, and mutual-aid actions.
These armed leftist and anarchist groups are also part of a much larger and longer tradition of organizing for community and self-defense by marginalized groups who are faced with intimidation and terrorism, and who—with cause—see police as part of the problem rather than a solution. The Black Panthers are an obvious reference point from the American civil rights movement of the 1950s and 60s, when armed community defense arguablyplayed a more important role in supporting the cause of racial justice than the conventional narrative acknowledges. John Brown Gun Clubs have been around for years, and their history is intertwined with an antifascist movement called Redneck Revolt that surged after Trump’s election in 2016. More recently, this movement has spawned efforts like We Are the Ones We’ve Been Waiting For’s Arm the Girls initiative, which aims to promote a culture of self-defense among BIPOC trans femmes. It has also birthed organizations like Sacramento’s Pride Was a Riot, who share an antifascist ethos with JBGCs while focusing their energy on support and defense of the local queer community.
In 2022, Crowd Counting Consortium recorded more than 5,700 right-wing protests, counter-protests, rallies, demonstrations, and direct actions across nearly 1,650 different U.S. cities and towns, where “right-wing” includes everything from Republican partisan rallies to demonstrations by alt-right and far-right extremists. This post summarizes a number of patterns and trends we gleaned from those events.
Overall, we saw little change in the scale, form, and themes of right-wing protest activity from 2021 to 2022, but that wide-angle view conceals significant increases in the past year in right-wing extremist activity centered on white supremacy and antipathy toward the queer community. Counts of protest events by issues raised also reveal the Christian nationalist character of right-wing activism in the U.S., the intensity of mobilization against public COVID mitigation measures, and the declining relevance of Donald Trump.
CCC makes and freely shares the data on which this analysis is based in hopes of supporting scholarship, journalism, and activism on these issues. For details on definitions and methods underlying these data, please see our coding guidelines. To access the data and documentation, please visit our GitHub repository. If you are a scholar, researcher, journalist, or activist who is interested in working with the data set and have questions about how to use it, please contact Jay Ulfelder at julfelder@hks.harvard.edu. This post is based on data recorded as of December 30, 2022, so future summaries for the same period may show slightly different values as we record new events or revise previous entries.
Counts
As noted at the start of this post, CCC logged more than 5,700 right-wing events in 2022. That’s a 23-percent increase over the roughly 4,700 we recorded in 2021.
While the number of events captured in our data set grew, we saw no clear shift in the scale of participation in those events. Information about crowd size was only available for about 1,500 of the 5,700 events we recorded in 2022, or 27 percent.
Across all events with reported crowd size or photo or video evidence of it, we saw a total of nearly 300,000 participants, give or take several tens of thousands. That’s down from nearly 400,000 in 2021, but we had information about crowd size for a larger number of events that year (about 2,200 of 4,700, or 47 percent).
The mean crowd size at events with data on that feature was 186, up a bit from 171 in 2021. The median crowd size was 24—the number we assign when reports say “dozens” and we lack additional information—which was down from 40 in 2021.
The single-largest right-wing event we logged in 2022 was a Trump rally repeating lies about election fraud to a reported crowd of 20,000–55,000 people at Canyon Moon Ranch in Florence, Arizona, on January 15, 2022.
Many hundreds of the events for which we lack information about crowd size are flag waves, vigils, and other demonstrations that repeat weekly for long spells, or daily for some fixed period of time. Organizers typically post flyers for these events on their social media feeds or list them in their online calendars, but they generally aren’t covered by the press, and we rarely find after-the-fact images or videos of them in other sources that would allow us to estimate crowd size.
Arrests, injuries, and property damage were rare at right-wing protest events in 2022. We only saw arrests of right-wing participants at 52 events (1.0 percent); reported injuries of right-wing participants at 18 events (0.3 percent); and property damage by right-wing participants at 13 (0.2 percent). Those figures were all down from 2021, when we recorded arrests at 67 events (1.4 percent), injuries at 29 (0.6 percent), and property damage at 17 (0.4 percent). We did not observe any deaths of right-wing participants at right-wing protests in 2022, down from one rather prominent event in 2021.
Consistent with those trends, we also saw a decline in armed right-wing protests in 2022, where “armed” means that at least one participant visibly carried a firearm. Our count of those events fell from 103 (2.2 percent) in 2021 to 70 (1.2 percent) in 2022.
Themes
For decades, faith-based anti-abortion activism has served as the rhythm section of right-wing political mobilization in the United States, and that pattern held in 2022. As shown in the chart below, religion and reproductive rights were the two most common themes last year, each appearing in protester claims at more than 2,000 of the roughly 5,700 events we recorded, or over one-third. Patriotism was the third-most common theme, rounding out the trifecta that makes plain the Christian-nationalist character of much contemporary right-wing activism in the United States.
The next several bars in the chart might seem like a hodge-podge of disparate themes—civil rights, COVID, health care, and education—but in 2022 they represented a coherent cluster linked by opposition to public-health measures taken in response to the COVID-19 pandemic. With slogans like “My body, my choice” and “Let them breathe” and often waving Gadsden flags, protesters railed against the “tyranny” of mask and vaccination mandates in schools and workplaces, including but not limited to hospitals, government contractors, and the military. In a small share of these events, protesters decried vaccines altogether or parroted theories about global conspiracies (Plandemic, The Great Reset) involving various nefarious elites or secret cabals (Bill Gates, George Soros, Anthony Fauci, Hillary Clinton, Joe Biden).
Two of the next three most-common themes were the presidency and democracy, and a substantial share of those events are ones where speakers or protesters amplified Donald Trump’s baseless and destructive claims of fraud in the last presidential election. Some 20 of those events in 2022 featured Donald Trump himself, with an average audience of about 5,000. That count of Trump rallies was much higher than the eight we saw in 2021—including the so-called March to Save America near the U.S. Capitol on January 6th—but the average attendance was down sharply from more than 13,000 that year.
Racism also appears in the top 10, but not in a good way. Virtually all of the right-wing events associated with that theme in 2022 involved either opposition to anti-racism protests from the left (e.g., Black Lives Matter) or open assertions of white supremacy by alt-right and neo-Nazi groups like Patriot Front, White Lives Matter, and NSC-131.
LGBTQ+ rights landed just outside the top for similar reasons. As discussed in a previous blog post and shown again in the chart below, right-wing protests targeting pride events, support for LGBTQ+ students in schools, drag shows, and other queer spaces surged in 2022, especially in the second half of the year. In December 2022 alone, we recorded more than 40 anti-LGBTQ+ protests, four-fifths of them specifically targeting drag shows or drag story hours. Although these events still represented a relatively small share of right-wing protest activity overall, they were just one part of a much broader wave of reactionary vitriol directed at the queer community that has also included scores of proposed and passed state laws; dehumanizing and dangerous speech from right-wing infotainment celebrities and other conservative elites; targeted hate from prominent social media accounts; open or anonymous threats to terrorize public servants, performers, and small-business owners; book-banning campaigns; vandalism; arson; and murder.
Rhetoric
We can also use a word cloud of terms from protesters’ claims to examine the content of right-wing protest activity in 2022. This past spring, CCC began using the ‘claims’ field in our data set to capture verbatim as many non-duplicate slogans and chants we see in photos and video and from, and prose about, each event as we can, along with coders’ summaries of protesters’ aims. The result is a rapidly-growing corpus of protest rhetoric that helps us represent what protests were about in participants’ own words.
The word cloud below summarizes data on nearly 2,400 words that appeared at least 10 times on right-wing protesters’ banners and placards or in their chants that we captured in 2022. There’s a lot to explore in that chart, but here are a few highlights.
Consistent with the bar chart we already saw of events by theme, several of the top terms here—”life”, “abortion”, “baby”—demonstrate the centrality of anti-abortion activism in right-wing protest activity. “God”, “Jesus” and “pray” also land toward the top of the distribution, underscoring the specifically religious character of much of the right’s anti-abortion activism.
The appearance of “white” in the top five terms demonstrates the prominence of white-nationalist and white-supremacist groups in right-wing protest activity in 2022. The single most common phrase here was “White lives matter”, but others such as “Make white babies”, “Protect white children”, and “Stop white genocide” also boosted the prevalence of this term.
A host of relatively prominent terms reflect the tenor of protests against public-health measures taken in response to the COVID-19 pandemic: “mandate”, “freedom”, “mask” and “unmask”, “COVID”, “vax” and “vaccine”, “breathe”, “tyranny”, and “comply”, to name a few.
“Trump” was more common than “Biden” in 2022, but “Brandon” was more common than both, reflecting both the decline in Trump’s prominence as a focal point of right-wing activism and the prominence of the “Let’s go, Brandon” slogan as an expression of conservative and reactionary disgust with Democrats. (See next chart for more on that.)
The appearance of homophobic and transphobic slurs and other malicious terms from protests targeting pride festivals, drag shows, and other queer spaces in the middle and lower tiers of words in the cloud illustrates the foregrounding of anti-LGBTQ+ claims in right-wing activism last year. Examples of this dangerous speech include: “groomer”, “grooming”, “sexualizing” (from phrases like “Stop sexualizing kids”), “pedo”, “pedophile”, and “pervert”.
We can also get a sense of the tone of right-wing protest activity in 2022 by counting the full verbatim phrases we captured. First, though, remember that we don’t record duplicate claims from single events—for example, even if we see many people at an event holding “I am the pro-life generation” signs, we only record that phrase once—and we can only record claims we see or hear in images and reporting from an event. So, these tallies should be understood as counts of the number of events at which each phrase was evident to us, rather than a fuller census of the occurrence of those phrases. What’s more, we only started recording verbatim claims in a consistent fashion in spring 2022, so phrases that appeared in the first few months of the year, when abortion and COVID mandates were central themes (see the next section), are likely to be underrepresented.
With those caveats in mind, here’s a chart of the 20 phrases we saw most often.
While all of the year’s major themes—abortion, COVID mandates, and structural racism—still bubble to the top, antipathy toward President Biden (“let’s go brandon”, “fuck joe biden”) also becomes clearer in this view as a common thread linking protests on a variety of themes.
The prevalence of Thin Blue Line flags reminds us of the right’s veneration of police, and the way that the George Floyd uprising of 2020 spurred a reactionary backlash that continues to shape right-wing activism more than two years later.
The appearance of “my body my choice” in the top 10 illustrates how right-wing protesters often co-opt language from liberal and left-wing human rights movements, perhaps to try to legitimize their claims to a broader audience. In this case, right-wing protesters have repurposed what’s probably the central phrase of activism around abortion access in recent decades for their own protests against COVID masking and vaccination mandates.
Finally, the appearance of the QAnon-linked hashtag #WeWillAllBeThere in the top 20 reminds us of that movement’s persistence as a force in right-wing mobilization beyond the Trump presidency (and beyond the U.S.).
Dynamics
In the aggregate, right-wing protest activity in 2022 presented a few temporal patterns. The chart below shows monthly counts of protest events nationwide. The two apparent spikes, in March and October, both result from periods of coordinated activity against abortion: the semi-annual 40 Days for Life vigils outside clinics across the country in the spring and fall, and, in October, the annual National Life Chain action, which, according to organizers, involved more than 600 events in the U.S. alone. The spring was also a time of relatively heavy activity against COVID mandates (including various efforts inspired by Canada’s so-called Freedom Convoy), and counts crept up again in the fall as midterm elections approached.
When we group events by political themes and extend our gaze back through 2020, we also see how right-wing activism in the U.S. over the past few years has tended to bandwagon around specific issues, then collectively swarm toward a new theme as mobilization around the old one peters out, or a new trigger occurs.
To see what I mean, take a look at the chart below.
In early 2020, protests against COVID mandates surged alongside the pandemic.
In late May 2020, right-wing activism abruptly shifted to issues of racism or policing in response to the George Floyd uprising and largely stayed there until Trump lost the presidential election, at which point the Stop the Steal movement became the right’s focal point for a few months.
After the failure of the January 6 insurrection, conservatives and reactionaries laid low for a few months before swarming back to COVID-related protests as schools reopened and vaccination mandates came down.
When that wave finally receded in early 2022, activists apparently followed the lead set by conservative infotainment leaders and state lawmakers in 2021 and shifted their energy to protests against various (often imagined or nefariously misrepresented) aspects of queer identity and sexuality.
Right-Wing Extremism
CCC also records the names of all organizations that reportedly participate in each protest event, and we can use that information to explore the ebb and flow of activism by specific groups over time. The chart at the bottom of this section shows annual counts of U.S. protest events involving one or more a handful of selected far-right groups over the past three years.
Of the selected groups, the Proud Boys—whose former national chairman, Enrique Tarrio, is on trial in early 2023 for charges related to his involvement in the J6 insurrection—remained the most active in 2022, with more than 150 appearances, but that count was down significantly from the 210 we saw in 2021.
Various state chapters of the white-supremacist group White Lives Matter were involved in nearly 110 events in 2022, up from just 25 in 2021. Almost all of these appearances were concentrated on the group’s monthly “days of action,” which typically involve demonstrations or banner drops at locations not announced in advance.
In New England, white-nationalist NSC-131 went from six events in 2021 to nearly 30 in 2022, including one outside a hospital in Boston. By contrast, the better-known Patriot Front held steady at just 15 appearances in 2022, many of them brief but flashy marches or demonstrations. One, a protest against a pride festival in Boise in June, ended in a mass arrest.
The surge in anti-trans and anti-queer rhetoric and activism from the right in 2021 and 2022 has also birthed a number of new organizations focused specifically on that theme. Two exemplars of that trend were the maliciously-named Gays Against Groomers, who organized or appeared at 24 events and blamed queer people for the mass shooting at Club Q in Colorado Springs; and Protect Texas Kids, who appeared at 16 events, all in Texas and often alongside Proud Boys, armed militia members, and sometimes neo-Nazis. As we discussed in our September blog post on this topic and a recent Daily Kos piece described as well, these protests were regularly met with large, sometimes armed, often joyful, and often successful community defenses.
Protester/Counter-Protester Interactions
Last but not least, in cases where counter-protests occur, CCC records information about those actions as well. In the data set, a unique ID ('macroevent') links each counter-protest to its target(s), and that allows us to generate statistics summarizing the forms and consequences of those interactions.
CCC defines a counter-protest as an action that is organized, or occurs, in direct response to another action and usually (but not always) engages directly with that original action. See our coding guidelines for more details.
Of the more than 5,700 right-wing events we recorded in 2022, nearly 447 (8 percent) were counter-protests, and another 376 (7 percent) were counter-protested. In total, 822 of the right-wing events we recorded in 2022 were part of a set of protest/counter-protest interactions. In fractional terms, that’s about 14 percent, which is essentially unchanged from the 13 percent we saw in 2021.
Of the 845 protester/counter-protester interactions we recorded in 2022, at least one protester on at least one side visibly carried a firearm at 56 of them, or about 7 percent of the time—the same rate as 2021 (45 of 691, also 7 percent). Protesters were visibly armed on both sides in 12 of those 55 armed interactions in 2022, double the count of mutually armed interactions we saw in 2021 (6).
Injuries occurred on one of both sides of 49 of 845 protester/counter-protester interactions in 2022, or less than 6 percent of the time. That was down slightly from 48 of 691 (7 percent) interactions in 2021. In 2022, only 5 of those 49 cases with casualties involved injuries on both sides, compared with 18 of 48 in 2021.
In 2022, the incidence of injuries at armed protester/counter-protester interactions was about twice as high as it was at unarmed ones: 7 of 49, or 13 percent vs. 42 of 789, or 5 percent. What we can’t say from those summary statistics is which way the causal chain runs: does the presence of firearms increase the risk of violent confrontations between protesters and counter-protesters, or are protesters more likely to bring firearms to actions that present a higher risk of violence with or without the guns? Our data offer some ways to explore that question, but doing it properly would require a more complex analysis than we can undertake for this annual review, so we’ll aim to take it up in a future post or paper.
Finally, we can also report that assaults, fights, and other forms of physical scuffling which may or may not have caused injuries occurred at 106 of the 845 protester/counter-protester interactions we logged in 2022, or nearly 13 percent of the time. By comparison, we saw physical altercations at 99 of 689 protester/counter-protester interactions in 2021, or more than 14 percent of the time. In February, one person—60-year-old June Knightly—was killed and five others wounded when a right-wing counter-protester grabbed a gun from his home and shot into a group of volunteer traffic marshalls during a march for justice for Amir Locke in Portland, Oregon.
This is a guest post by Mason Holland, an undergraduate student at the University of Connecticut majoring in Political Science. He also serves as President of the Student Body.
In 2020, the United States bore witness to the Black Lives Matter (BLM) protests that arose in the wake of the killings of Ahmaud Arbery, Breonna Taylor, and, most prominently, George Floyd. BLM protests have been cited as among the largest organized demonstrations in recent US history as Americans and world citizens alike protested police brutality, anti-racism, and called for substantive institutional and legal shifts pertaining to policing. What was the impact in the state of Connecticut?
From May 31 to December 31, 2020, 105 of Connecticut’s 169 towns held at least one protest, with some towns hosting multiple events. In total, there were 316 protests listed in the data of the Crowd Counting Consortium (CCC), with many events being concentrated in a few, specific towns. The towns that saw the most anti-racist protests were Southbury with 33, Hartford with 29, New Haven with 27, Bridgeport with 16 and Stamford with 14, all together accounting for about 37% of all Connecticut anti-racism protests listed in CCC data for that time period.
On that list, Southbury is a notable anomaly, with the town of just under 20,000 accounting for the highest concentration of demonstrations. The anomaly can be attributed to the consistency of social justice group, Justice for Southbury, in holding anti-racist demonstrations on a weekly basis from late May to December of 2020. It is also important that the media reported on the weekly protests so that CCC could gather the information; the press may lose interest in weekly events, especially outside of major metropolitan areas.
While all the aforementioned demonstrations can be broadly categorized as anti-racism protests they generally differed in terms of the resulting impact of individual demonstrations. The evidence of impact is mixed, with some of it demonstrating a correlation between a protest and outcome and other stronger evidence substantiating a causal tie.
In New Haven and New London, demonstrators called for the removal of each town’s Christopher Columbus statue. In both cases, protest organizers argued that Christopher Colombus represented a deeply racist and colonial history of America and that honoring him with a statue was deeply offensive to residents of color. New London saw a series of demonstrations over late May and early June 2020 calling for a series of changes, including the removal of the Columbus statue. After multiple demonstrations and one in which a group of youth activists vandalized the statue, the Town Council voted to remove the statue on July 16, 2020. Statue removal occurred similarly in New Haven as demonstrations and instances of vandalism led to the New Haven City commission voting to remove the statue on June 24, 2020. In both cases, it is evident that the advent of anti-racism protests in 2020 were crucial and consequential in both statues being removed.
In two other examples, the evidence is suggestive that protests led to policy change: the passage of the 2020 Police Accountability Bill and the simultaneous efforts to implement police reform in Connecticut. We see a correlation between the protests and the policy changes that followed. Despite being initially spurred by the killing of George Floyd, the Police Accountability Bill began to receive support from demonstrators in Connecticut in various ways. A Fairfield protest in June 2020 specifically called for House Bill 6004 to be passed through the Connecticut legislature. Protests in other towns, such as New Britain called for measures that ended up in the bill, such as the expansion of body camera use. These two demonstrations demonstrate preliminary evidence of a link between Anti-Racism demonstrations and the passage of the 2020 Police Accountability Bill. But we do not have enough evidence to state with certainty that they are causally linked.
In addition to protests that actively called for legislative action on police accountability, Hartford began to implement police reform in the wake of demonstrations. In June 2020, the city voted to “reduce and reorganize” the policing budget after days of demonstrations calling for reduced police allocation in favor of funding social services. While there is evidence to suggest a correlation between Connecticut demonstrations and police reform, there is not yet enough to suggest a causal link.
A key recognition we made is that in a few of these towns, Bridgeport, New London, Hartford and New Haven in specific, there were several demonstrations that occurred pre-2020 that laid the groundwork for policy changes and implementation. For example, all of these towns saw demonstrations, relating to the death of Jayson Negron, police brutality, and police reform stretching back months and years prior to May of 2020. This suggests that the history of protests allowed time for these demands to spread and develop within individual communities. Previous protests raised people’s consciousness about the issues.
This research is preliminary in establishing the true range of impacts that anti-racism protests in 2020 have had on Connecticut. It also opens future avenues of research that can be further developed through a closer analysis of those demonstrations through interviews, research into related government documents, and the systematic assessment of police reform and policy changes that were spurred on and inspired by anti-racism demonstrations.